Estimating Blast Yield
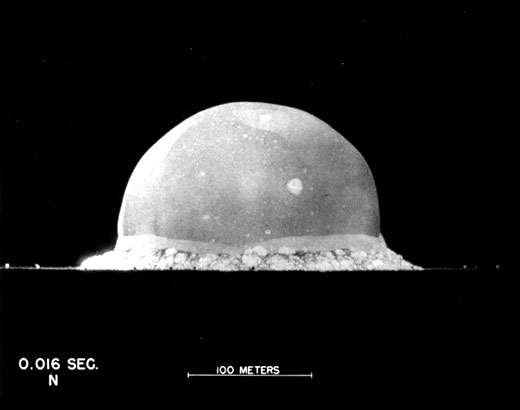
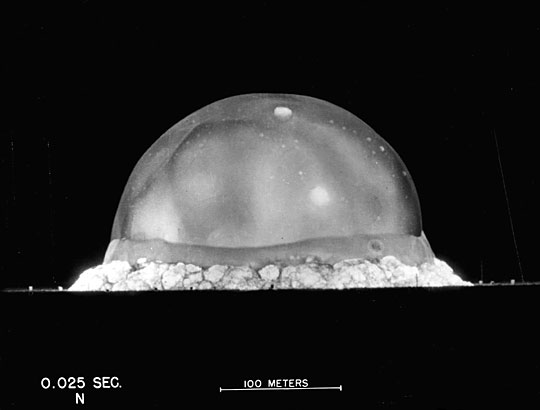
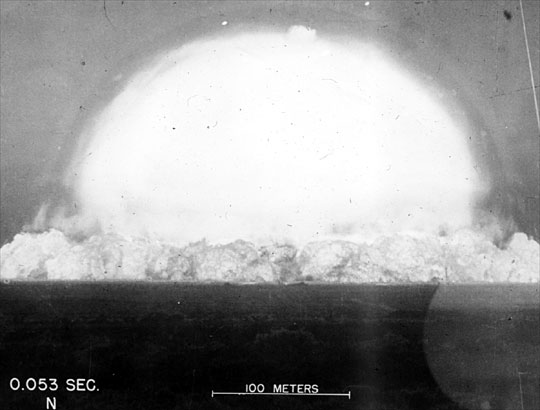
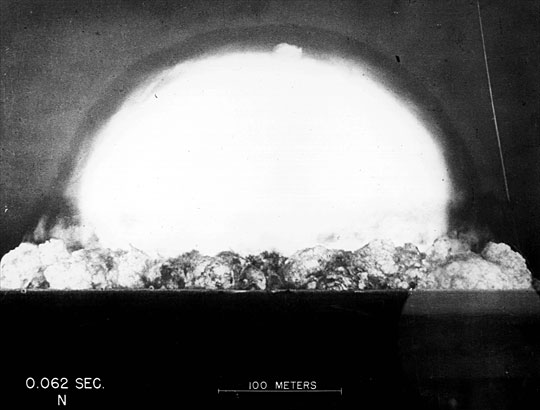
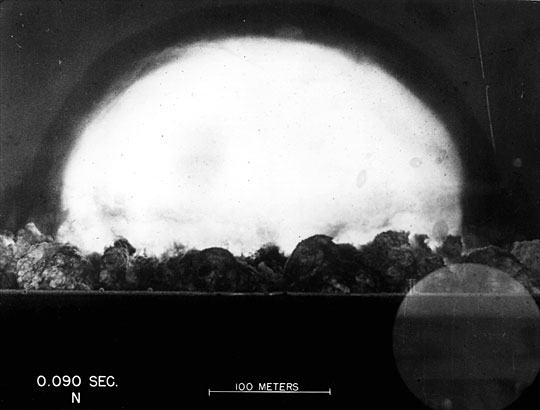
When photos of the first atomic bomb test were published, its blast yield was still classified. But there is enough information in this picture to determine it.
Start with approximate relationship between blast radius R and blast energy E:
| E | blast energy | |
| heat capacity ratio | 1.4 | |
| t | time | |
| air density | 1.2 |
A kiloton of TNT is equivalent to approximately , so yield in kilotons is
Plugging in the numbers from the released pictures, with radius measured from the thin blast wave line rather than the edge of the fireball:
| t | R | E |
|---|---|---|
| 0.016 | 107 | 23 |
| 0.025 | 126 | 21 |
| 0.053 | 164 | 18 |
| 0.062 | 181 | 21 |
| 0.090 | 194 | 14 |
The average over five images is 19 kT, which turns out to be pretty close to the now declassified value.
Source: Sanjoy Mahajan, The Art of Insight in Science and Engineering, chapter 5.2.2
Pictures from Atomic Archive